Health Toolkit
Software Toolkit to Enable System Health Monitoring.
- Keep the mission alive.
- Accelerate time to deployment.
- Facilitate preventative maintenance.
Providing a flexible, extensible framework for health monitoring
The heart of the Health Toolkit is the open standard, publish/subscribe DDS middleware in conjunction with an extensible data model to contain system health information.
Data Distribution Service

Making it easy to incorporate into an application
The toolkit contains additional components to facilitate integration into an application – so the application can act on health information and keep the mission alive.
It can be extended to run on custom and third party hardware in order to provide an integrated system and even platform-wide solution.

How does it work?
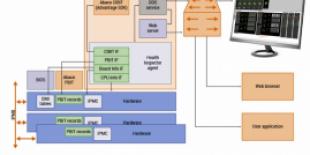
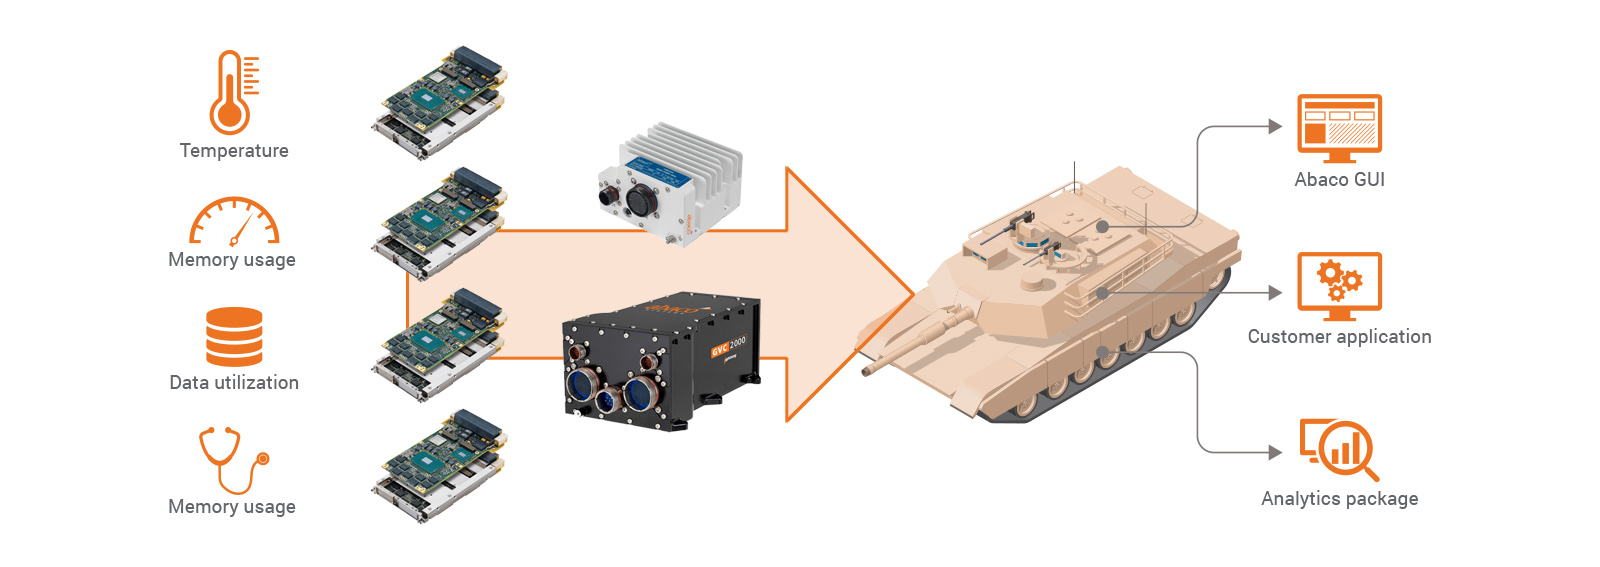
'Health Inspector' agent collects health information from boards and other components in a system.
Publishes on network using DDS middleware (open standard).
System data can be viewed in GUI, used in application, stored for analytics.
DDS Framework
Defined DDS data model for health monitoring.
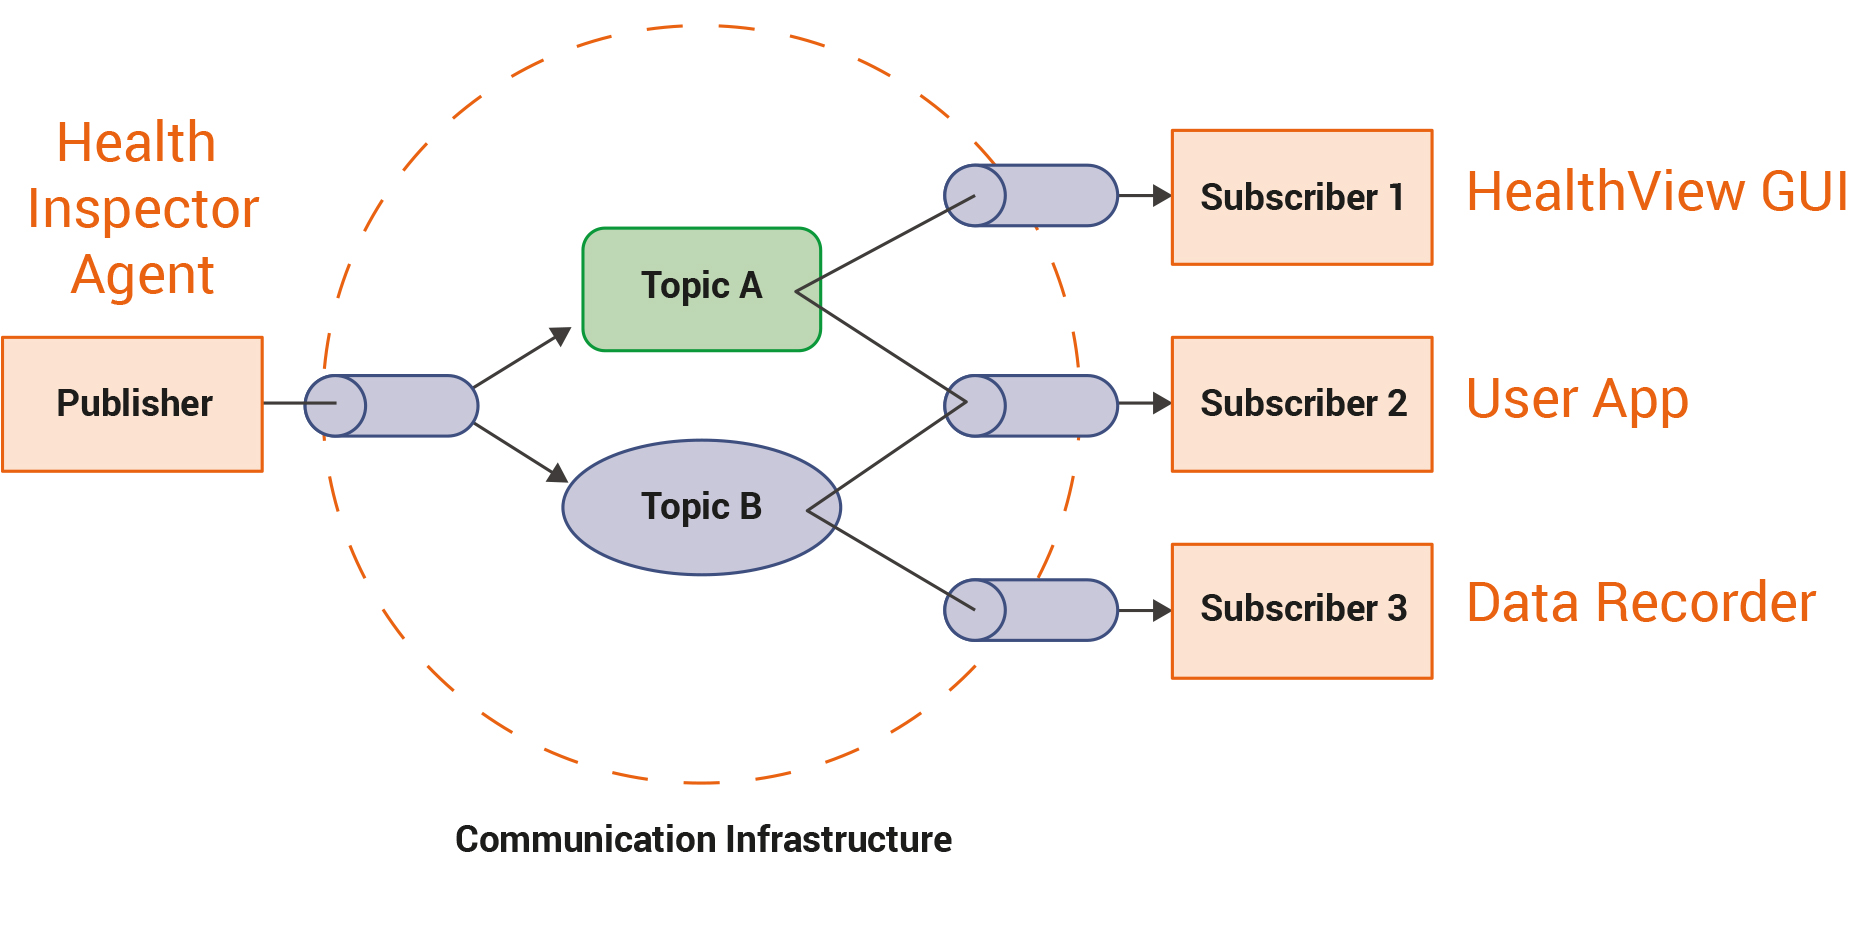
Health Inspector 'agents' running within a platform 'publish' health information conforming to data model. Any application can 'subscribe' to this information and use as it wishes.
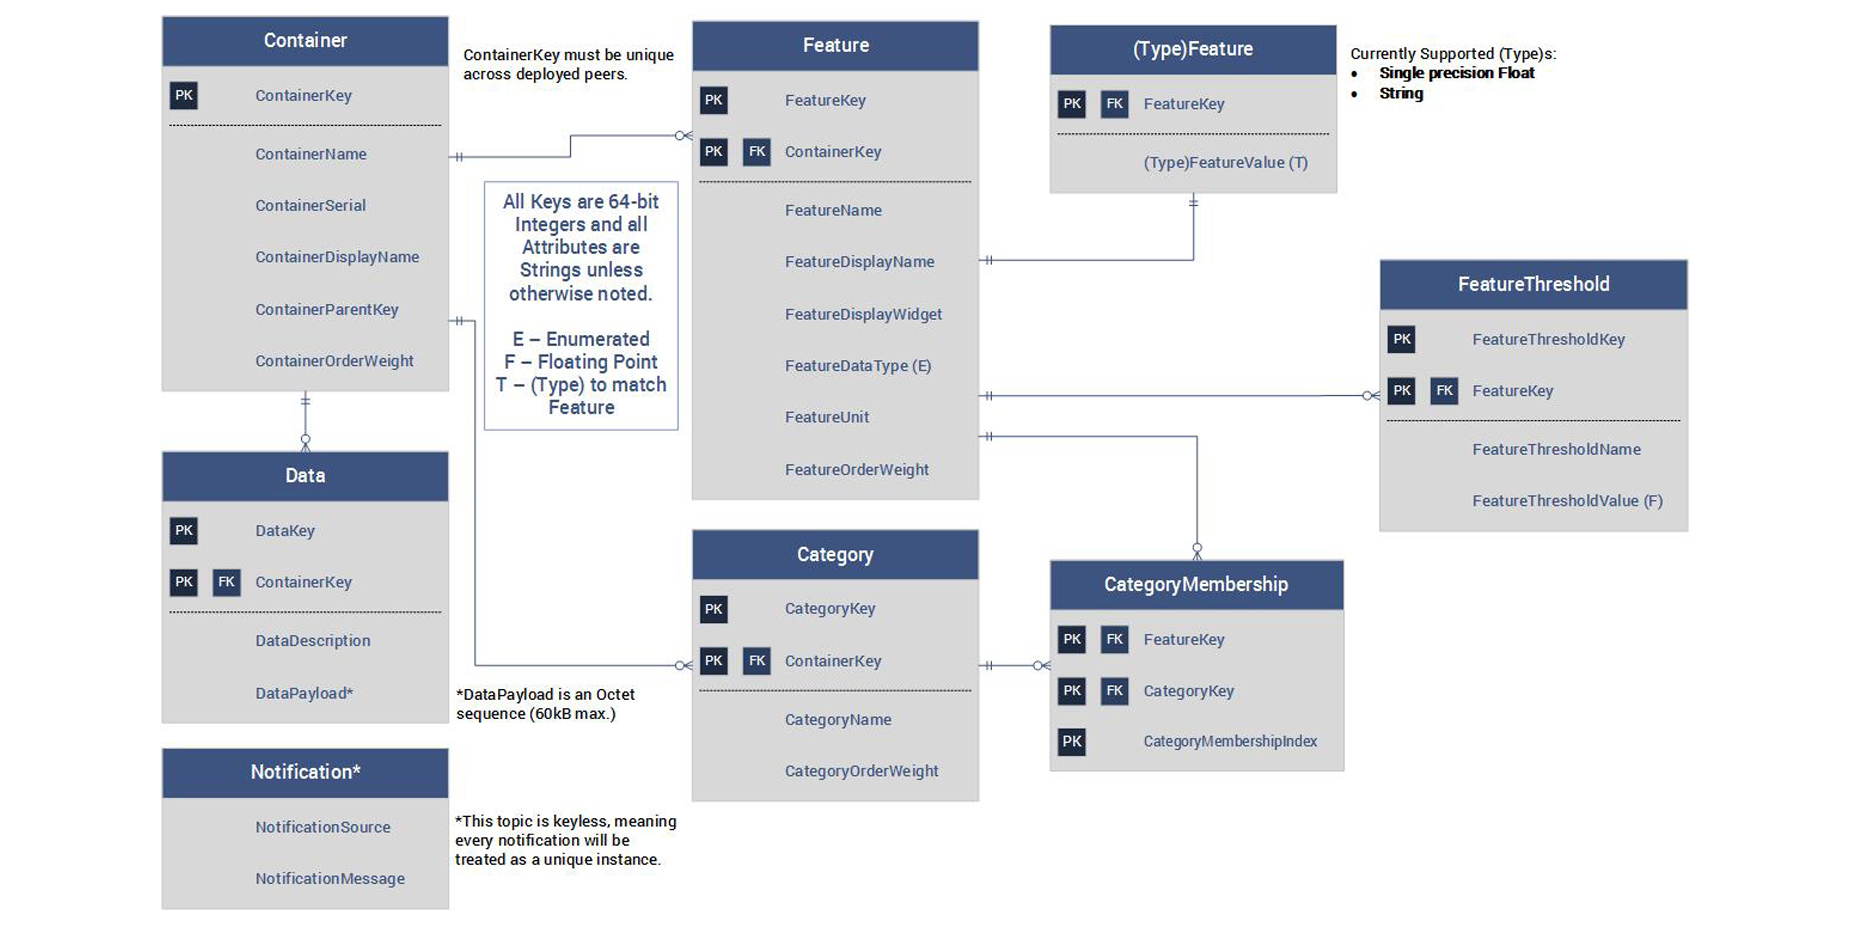
Data model is designed to mimic a relational database.
Visualizing the Data
Provides two ways to see the health data live.
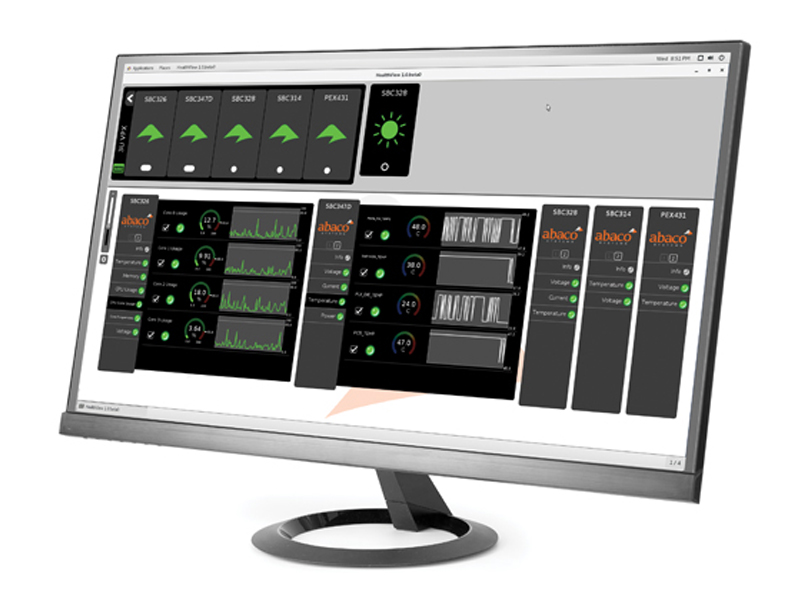
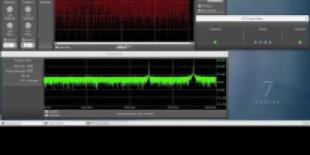
“HealthView” Dashboard – an interactive and intuitive view of the published health data.
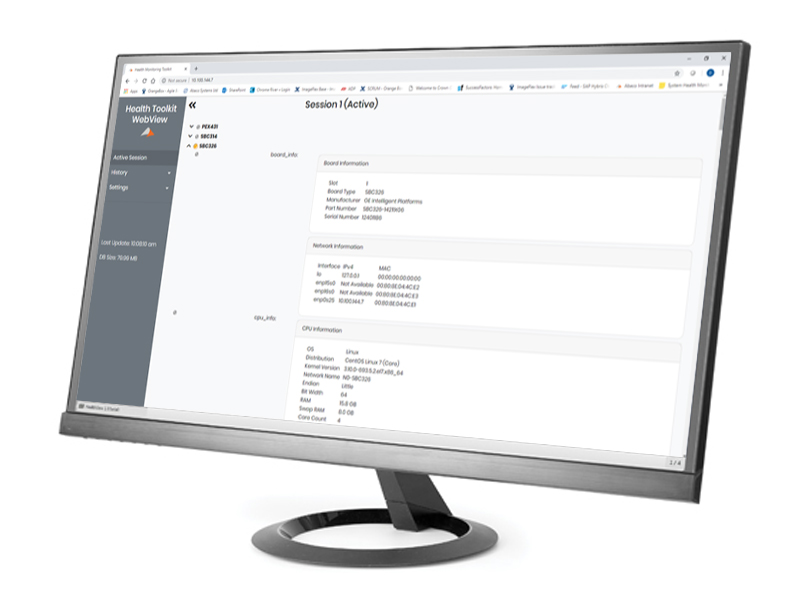
Web display – get all the live information from any common web browser.
'Health Inspector' Agent
Runs on CPU within platform – gathers and publishes health data.
A single agent can gather information for multiple boards in a VPX chassis.
Data examples for VPX boards:
- Temperatures: components and board
(via IPMI, and operating system) - Voltages (via IPMI)
- PBIT results (via IPMI)
- CIBIT results (via dedicated API)
- Resource usage: CPU, memory, disk etc.
(via operating system) - Custom data
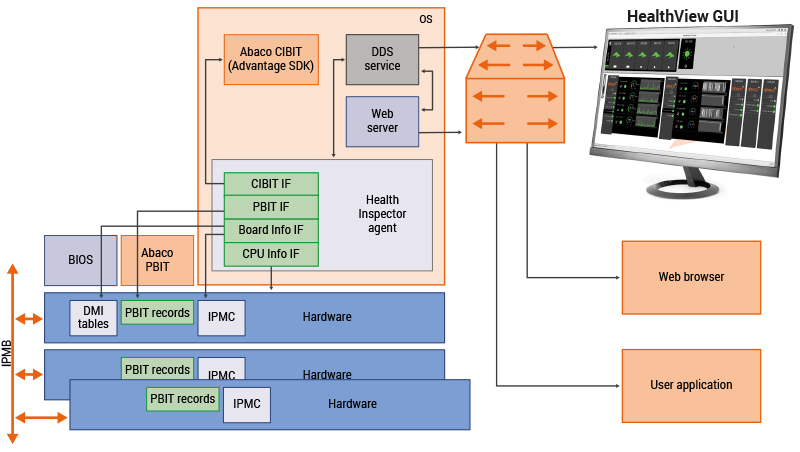
There can be multiple agents running on a platform.
Downloads

Manuals

White Papers

Brochures
Request A Quote
Health Toolkit

Contact An Expert
Looking for help with Health Toolkit

Get Support
Looking for help with Health Toolkit
